slice_plot
- slice_plot(netin, ax, nodelabels=None, timelabels=None, communities=None, plotedgeweights=False, edgeweightscalar=1, timeunit='', linestyle='k-', cmap=None, nodesize=100, nodekwargs=None, edgekwargs=None)[source]
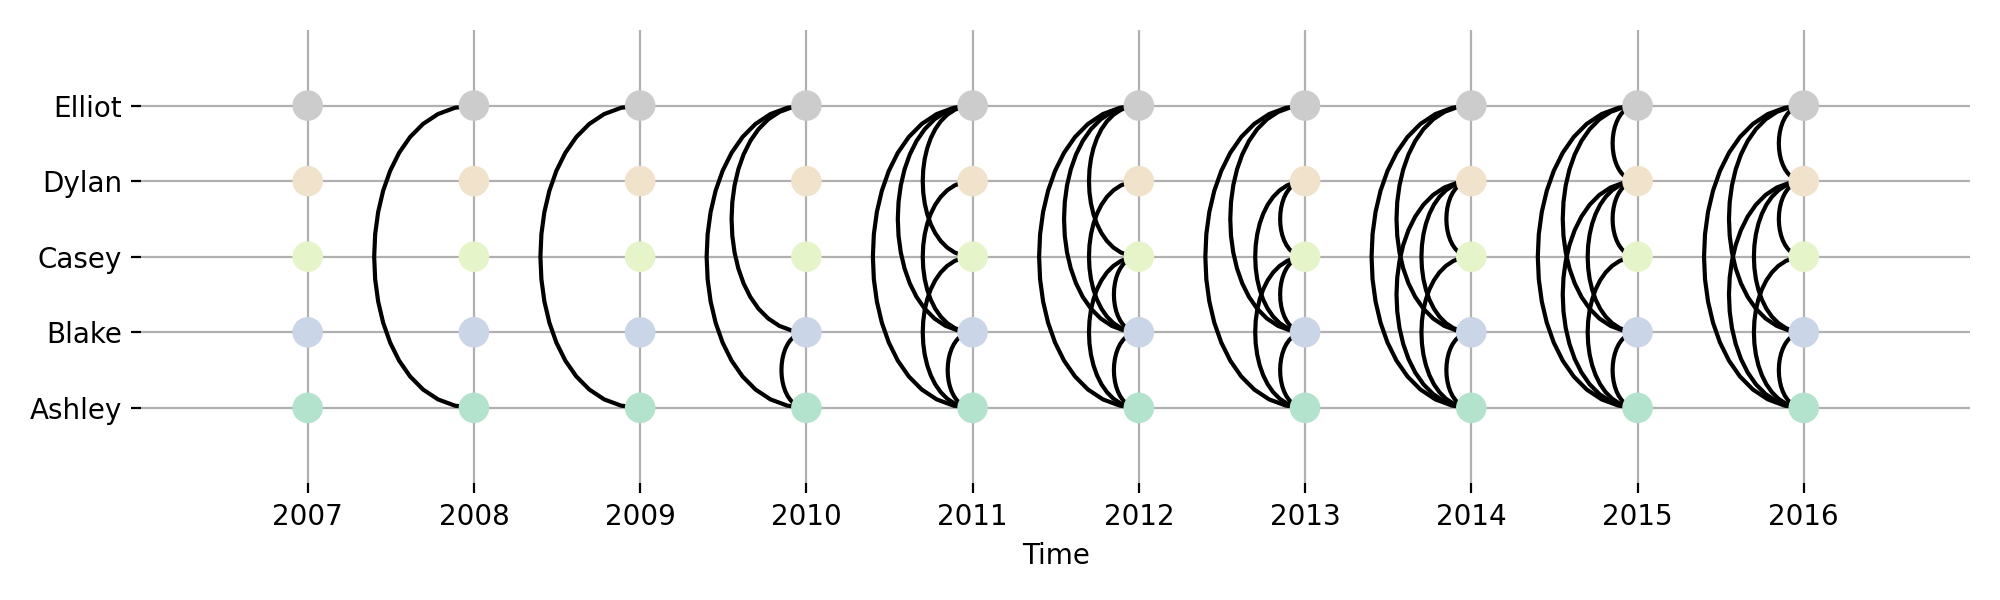
Fuction draws “slice graph”.
A slice plot plots all the nodes per time point as a column with Bezier curvers connecting connected nodes.
- Parameters:
netin (array, dict) – temporal network input (graphlet or contact)
ax (matplotlib figure handles.)
nodelabels (list) – nodes labels. List of strings.
timelabels (list) – labels of dimension Graph is expressed across. List of strings.
communities (array) – array of size: (time) or (node,time). Nodes will be coloured accordingly.
plotedgeweights (bool) – if True, edges will vary in size (default False)
edgeweightscalar (int) – scalar to multiply all edges if tweaking is needed.
timeunit (string) – unit time axis is in.
linestyle (string) – line style of Bezier curves.
nodesize (int) – size of nodes
nodekwargs (dict) – any additional kwargs for matplotlib.plt.scatter for the nodes
edgekwargs (dict) – any additional kwargs for matplotlib.plt.plots for the edges
- Returns:
ax
- Return type:
axis handle of slice graph
Examples
Create a network with some metadata
>>> import numpy as np
>>> import teneto
>>> import matplotlib.pyplot as plt
>>> np.random.seed(2017) # For reproduceability
>>> N = 5 # Number of nodes
>>> T = 10 # Number of timepoints
>>> # Probability of edge activation
>>> birth_rate = 0.2
>>> death_rate = .9
>>> # Add node names into the network and say time units are years, go 1 year per graphlet and startyear is 2007
>>> cfg={}
>>> cfg['Fs'] = 1
>>> cfg['timeunit'] = 'Years'
>>> cfg['t0'] = 2007 #First year in network
>>> cfg['nodelabels'] = ['Ashley','Blake','Casey','Dylan','Elliot'] # Node names
>>> #Generate network
>>> C = teneto.generatenetwork.rand_binomial([N,T],[birth_rate, death_rate],'contact','bu',netinfo=cfg)
Now this network can be plotted
>>> fig,ax = plt.subplots(figsize=(10,3))
>>> ax = teneto.plot.slice_plot(C, ax, cmap='Pastel2')
>>> plt.tight_layout()
>>> fig.show()
(
Source code,png,hires.png,pdf)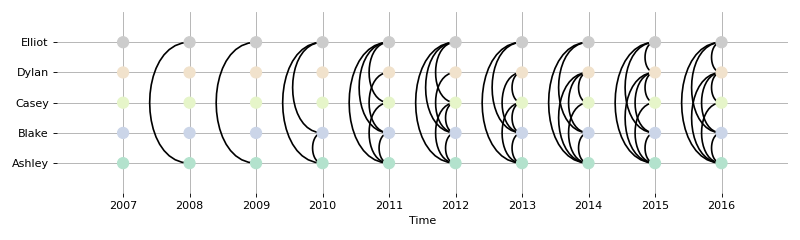