circle_plot
- circle_plot(netIn, ax, nodelabels=None, linestyle='k-', nodesize=1000, cmap='Set2')[source]
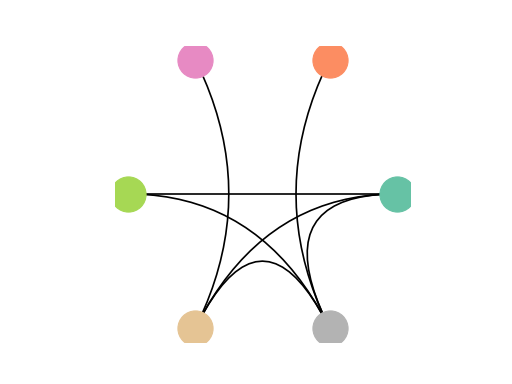
Function draws “circle plot” and exports axis handles
- Parameters:
netIn (temporal network input (graphlet or contact))
ax (matplotlib ax handles.)
nodelabels (list) – nodes labels. List of strings
linestyle (str) – line style
nodesize (int) – size of nodes
cmap (str) – matplotlib colormap
- Returns:
ax
- Return type:
axis handle
Example
>>> import teneto
>>> import numpy
>>> import matplotlib.pyplot as plt
>>> G = np.zeros([6, 6])
>>> i = [0, 0, 0, 1, 2, 3, 4]
>>> j = [3, 4, 5, 5, 4, 5, 5]
>>> G[i, j] = 1
>>> fig, ax = plt.subplots(1)
>>> ax = teneto.plot.circle_plot(G, ax)
>>> fig.show()
(
Source code,png,hires.png,pdf)